Sorry this is a bit off-topic, but maybe someone has some insight.
I have a pretty big cluster with a lot of shards (26618).
I am not following good practices as all data nodes are also master.
That disclaimer out of the way let me discribe the issue: wheneverf I try to reload or create an index-pattern in kibana, the cluster goes haywire for half an hour, load goes up to 1, garbage collector maxes out, heap usage as usual. Eventually the operation fails, and my logs say a lot of gc overhead messages.
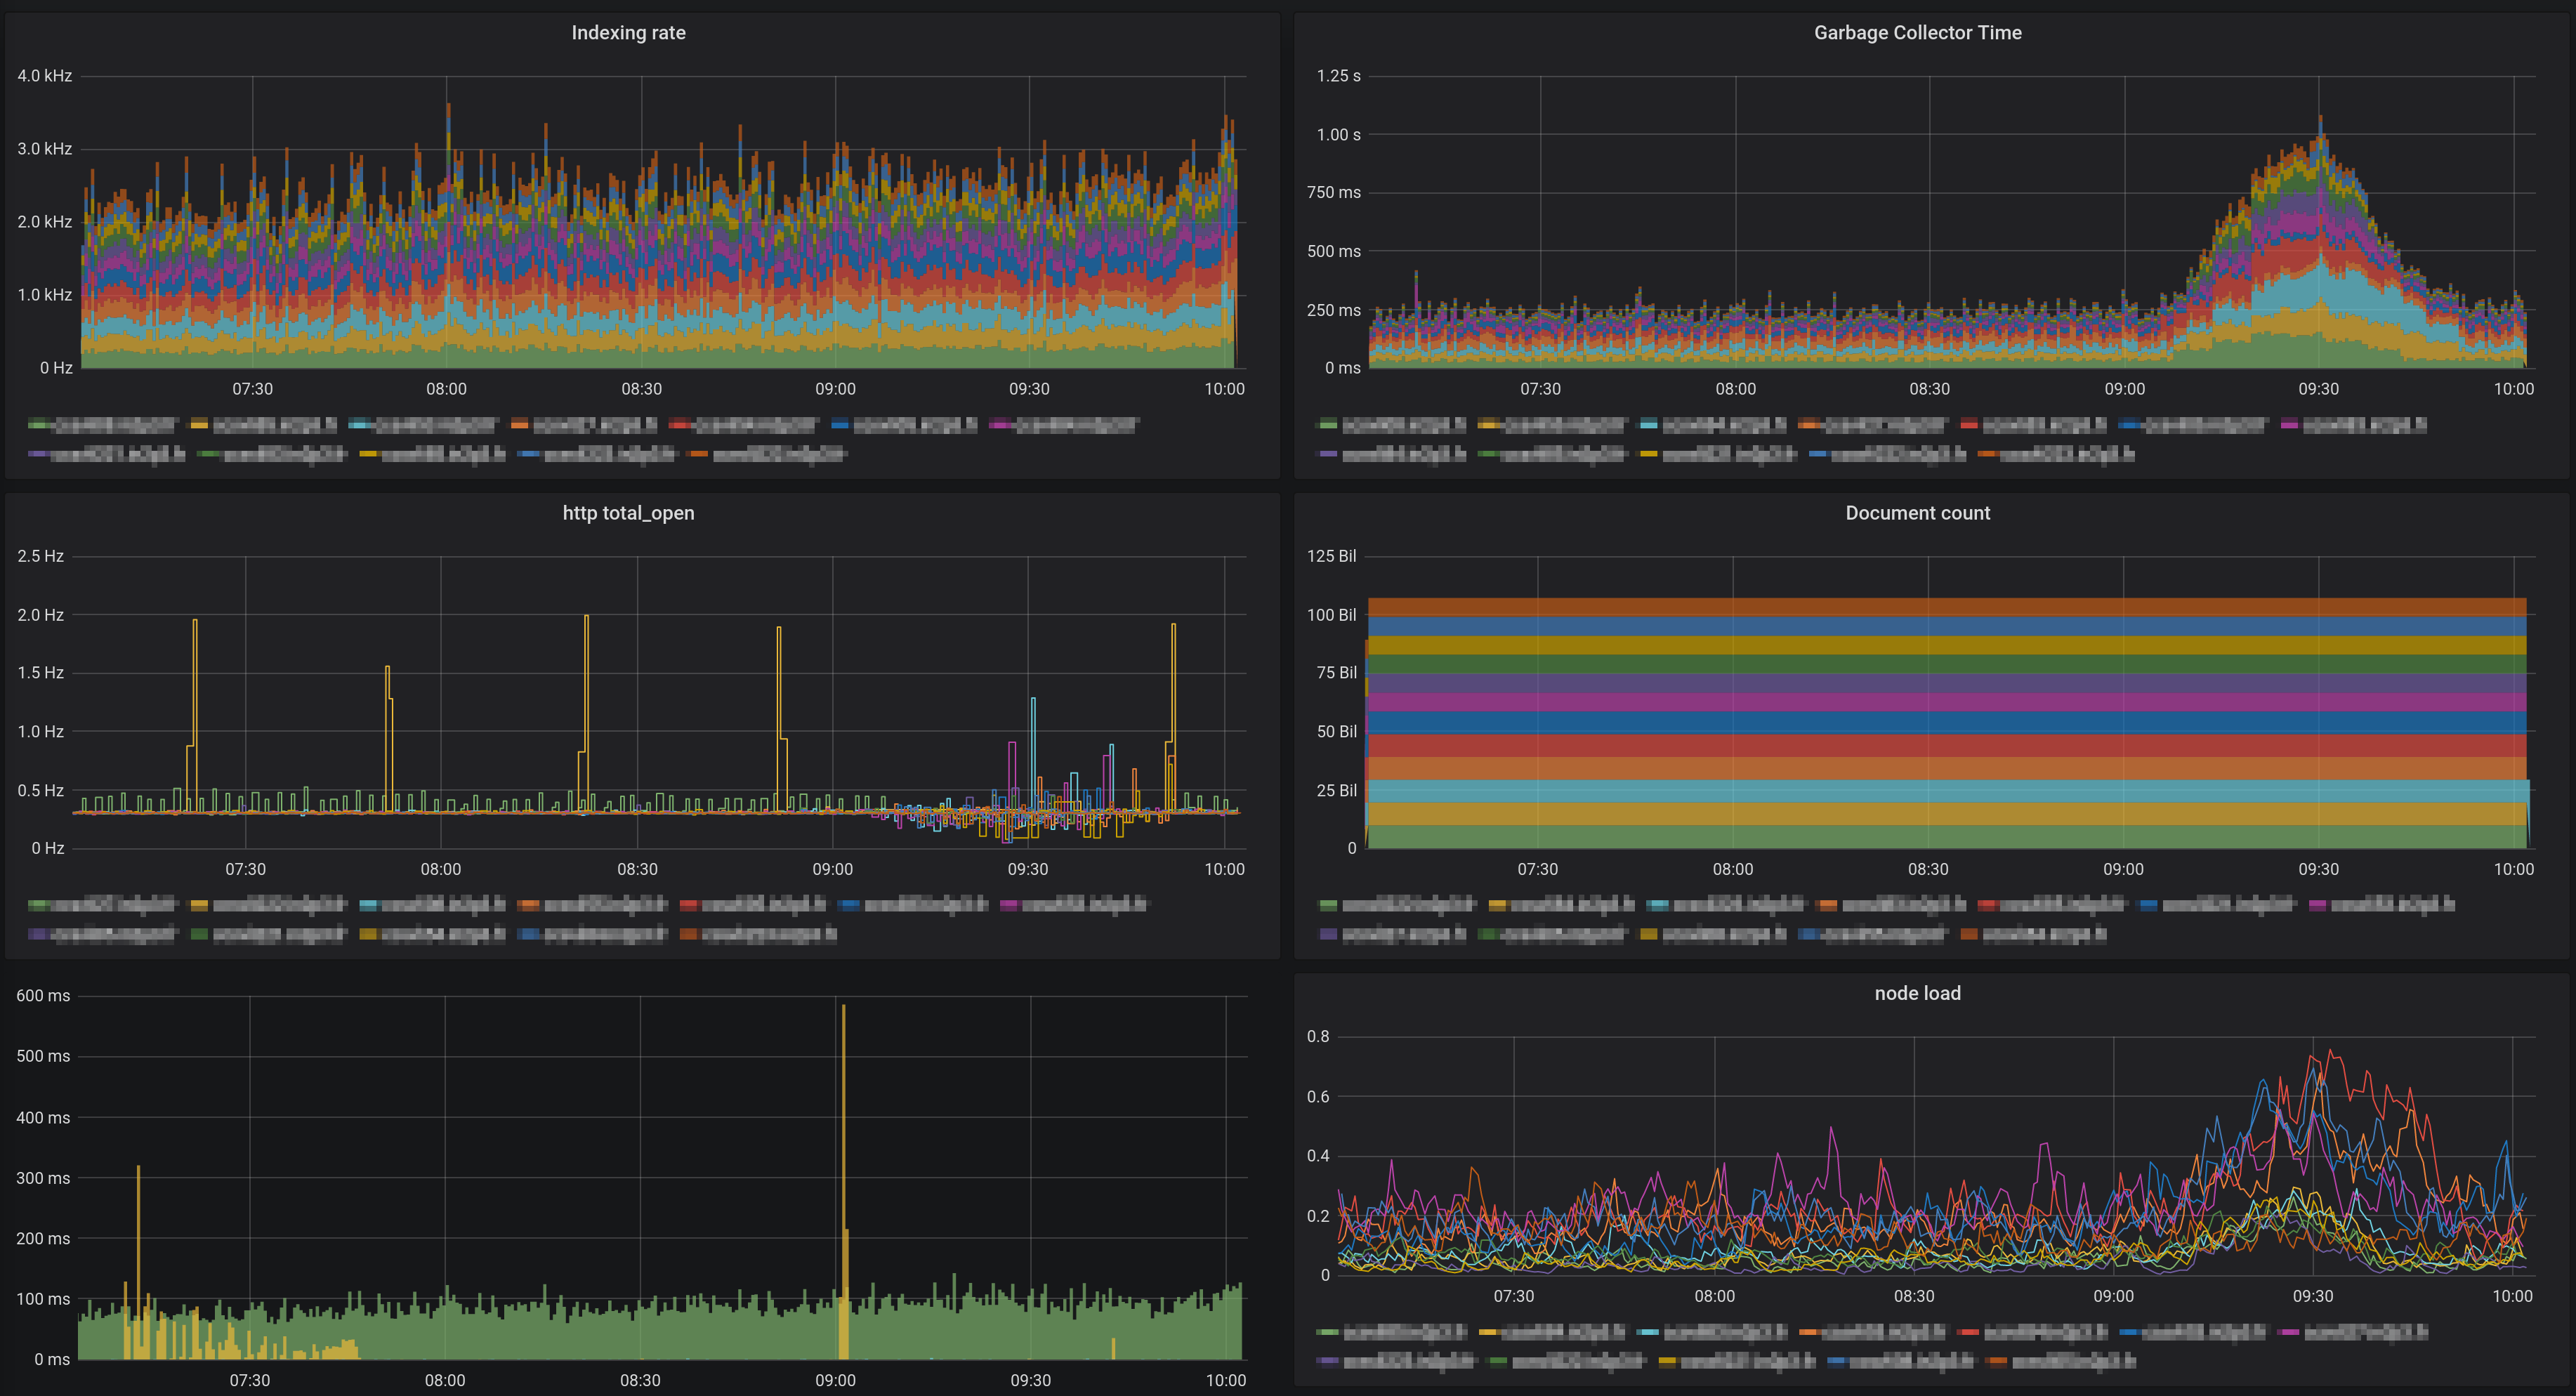
So here’s an example on what happens with some time scale.
9:04 Ingest software queued messages : 0
9:04 Number of lines in hot threads output : 33180
9:04 Average node load : 0.12
9:05 Click on Management > Saved Object > Index patterns > syslog-*
9:05 Load on all nodes begins to rise slowly
9:06 Number of lines in hot threads output : 47892
9:07 Number of lines in hot threads output : 125219
9:10 Number of lines in hot threads output : 235194
9:10 Average node load : 0.15
9:10 Ingest software queued messages : 2200
9:12 Ingest software queues messages : 0
9:20 Number of lines in hot threads output : 798329
9:20 Average node load : 0.26
9:22 Ingest software queued messages : 1900
9:23 Ingest software queued messages : 0
9:28 Number of lines in hot threads output : 878819
9:28 Average node load : 0.32
9:31 Ingest software queued messages : 3800
9:32 Ingest software queued messages : 0
9:32 - 9:55 Slow Return to normal
9:55 Number of lines in hot threasds output : 20292
Somewhere in-between kibana errors respBody is null